(coming soon)
As an administrator, you may want to keep tabs on what your JEMHC instance is doing, message/data volume and the status of inbound/outbound mail connection.
Step-by-step guide
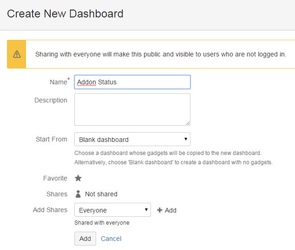
- As an admin, go to JIRA > Dashboards > Manage Dashboards, select Create new dashboard, call it "Addon Status" then click Add.
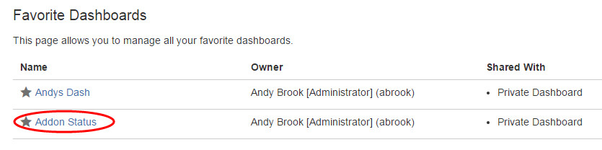
- Click Addon Status to access the new dashboard:
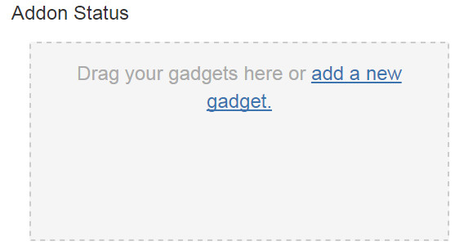
- Click add a new gadget:
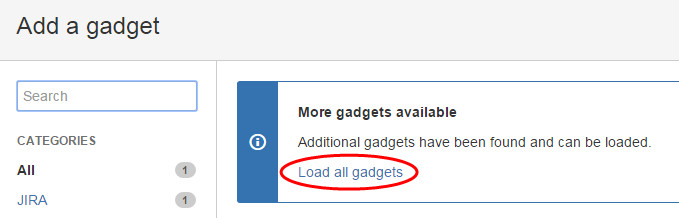
- As the JEMHC widget is described in our addon, get JIRA to go and load it:
- That should then allow you to search for JEMH, see the gadget entry below, then click Add gadget:

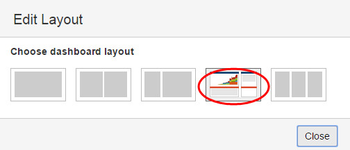
The new JEMHC widget will now be shown, for best layout use:
The Dashboard widget (below) has key areas:Area Description 
1 Message volume consumption 2 Data volume consumption 3 Volume usage summary 4 Inbound mail connections and status 5 Outbound mail connections and status
| Info |
|---|
Refresh is currently manual, via icon top right of gadget. |
Related articles
| Filter by label (Content by label) | ||||||||||||||||||
|---|---|---|---|---|---|---|---|---|---|---|---|---|---|---|---|---|---|---|
|
...