Install the Dashboard Gadget
Install the Dashboard Gadget
- Andy Brook [legacy acct] (Unlicensed)
Last updated: Jun 06, 2015
As an administrator, you may want to keep tabs on what your JEMHC instance is doing, message/data volume and the status of inbound/outbound mail connection.
Step-by-step guide
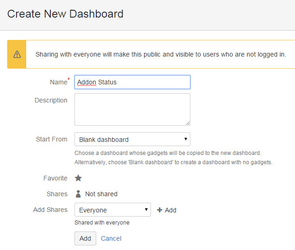
- As an admin, go to JIRA > Dashboards > Manage Dashboards, select Create new dashboard, call it "Addon Status" then click Add.
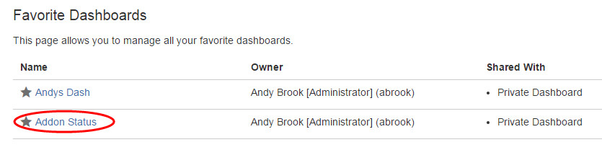
- Click Addon Status to access the new dashboard:
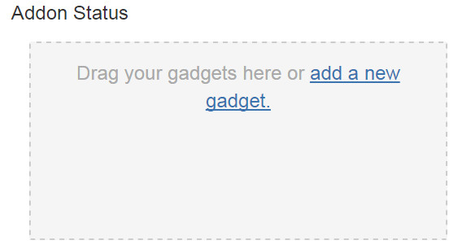
- Click add a new gadget:
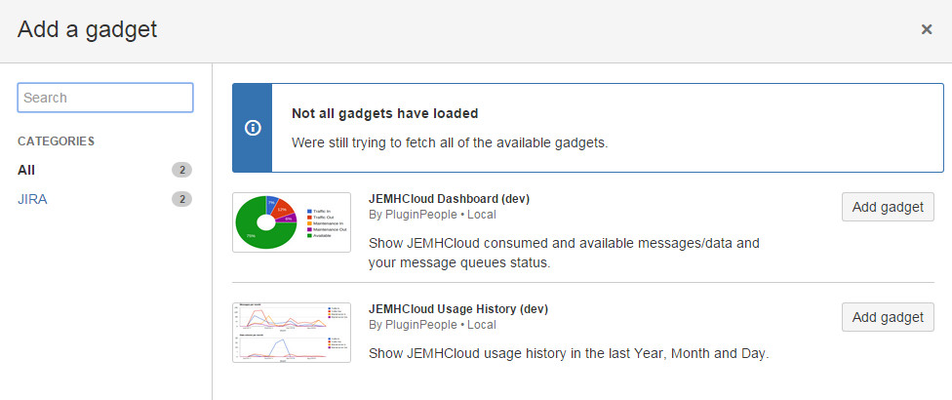
- As the JEMHC widget is described in our addon, get JIRA to go and load it:
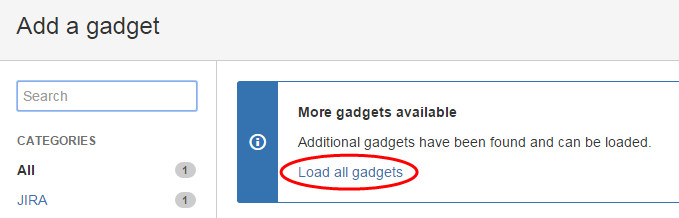
- That should then allow you to search for JEMH, see the gadget entry below, then add the required gadgets:
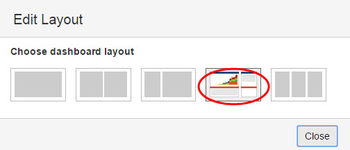
The new JEMHC widget will now be shown, for best layout use:
The Message Gadget is handy to keep an eye on current data and message volume. It can be used to monitor post-change outcome, (changing catchemail addresses for example)
Message/Data Gadget Area Description 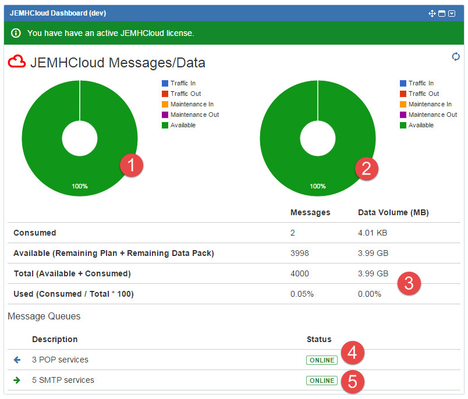
1 Message volume consumption 2 Data volume consumption 3 Volume usage summary 4 Inbound mail connections and status 5 Outbound mail connections and status Usage History Gadget can illustrate your trending usage of JEMHC
Usage History Gadget Description 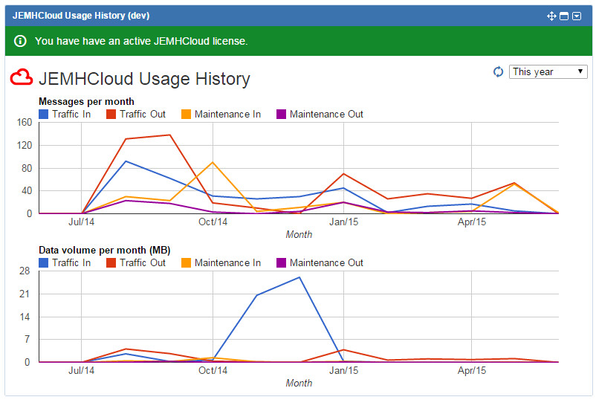
Traffic In Every email message pulled by JEMHC is a message consumed, every email message pulled and its data count, attachments and content sent to JIRA also counts towards data. Traffic Out Every email message sent by JEMHC is a message consumed, JEMHC sends one message per event with all recipients as BCC to minimize message and data volume. Maintenance In Typically, message that do not 'match' a JEMHC Profile incoming 'catchemail' address won't be processed, but still count as a message consumed and data. Maintenance messages are wasteful and should be minimized. See Common Problems relating to Unexplained/HighlevelsofMaintenancenotifications. Dropped messages also count as an inbound maintenance message. Maintenance Out Messages that won't get processed by JEMHC could be forwarded (see Profile > Non-catch Email Action), the default is to 'forward' that message to the forward user for review, which counts for message and data. Dropping non-matching messages is possible (be careful!). Other reasons for maintenance messages are that the Profile determined that it can't or shouldn't be processed, possibly due to blacklisting or other profile driven condition. Ping 'test' Messages also count as an outbound maintenance message.
Refresh is currently manual, via icon top right of gadget.
Related articles
, multiple selections available,
Related content
Add/Remove (Custom) field to Jira/Service Management/Transport Desk Create Notifications
Add/Remove (Custom) field to Jira/Service Management/Transport Desk Create Notifications
Read with this
Select fields to be shown in a Jira/Service Management/Transport issue update notification
Select fields to be shown in a Jira/Service Management/Transport issue update notification
Read with this
Manipulate webhook data in notification templates
Manipulate webhook data in notification templates
Read with this
App licensing
App licensing
Read with this
How-to articles
How-to articles
Read with this
Handling signatures, replies and forwarded messages
Handling signatures, replies and forwarded messages
Read with this